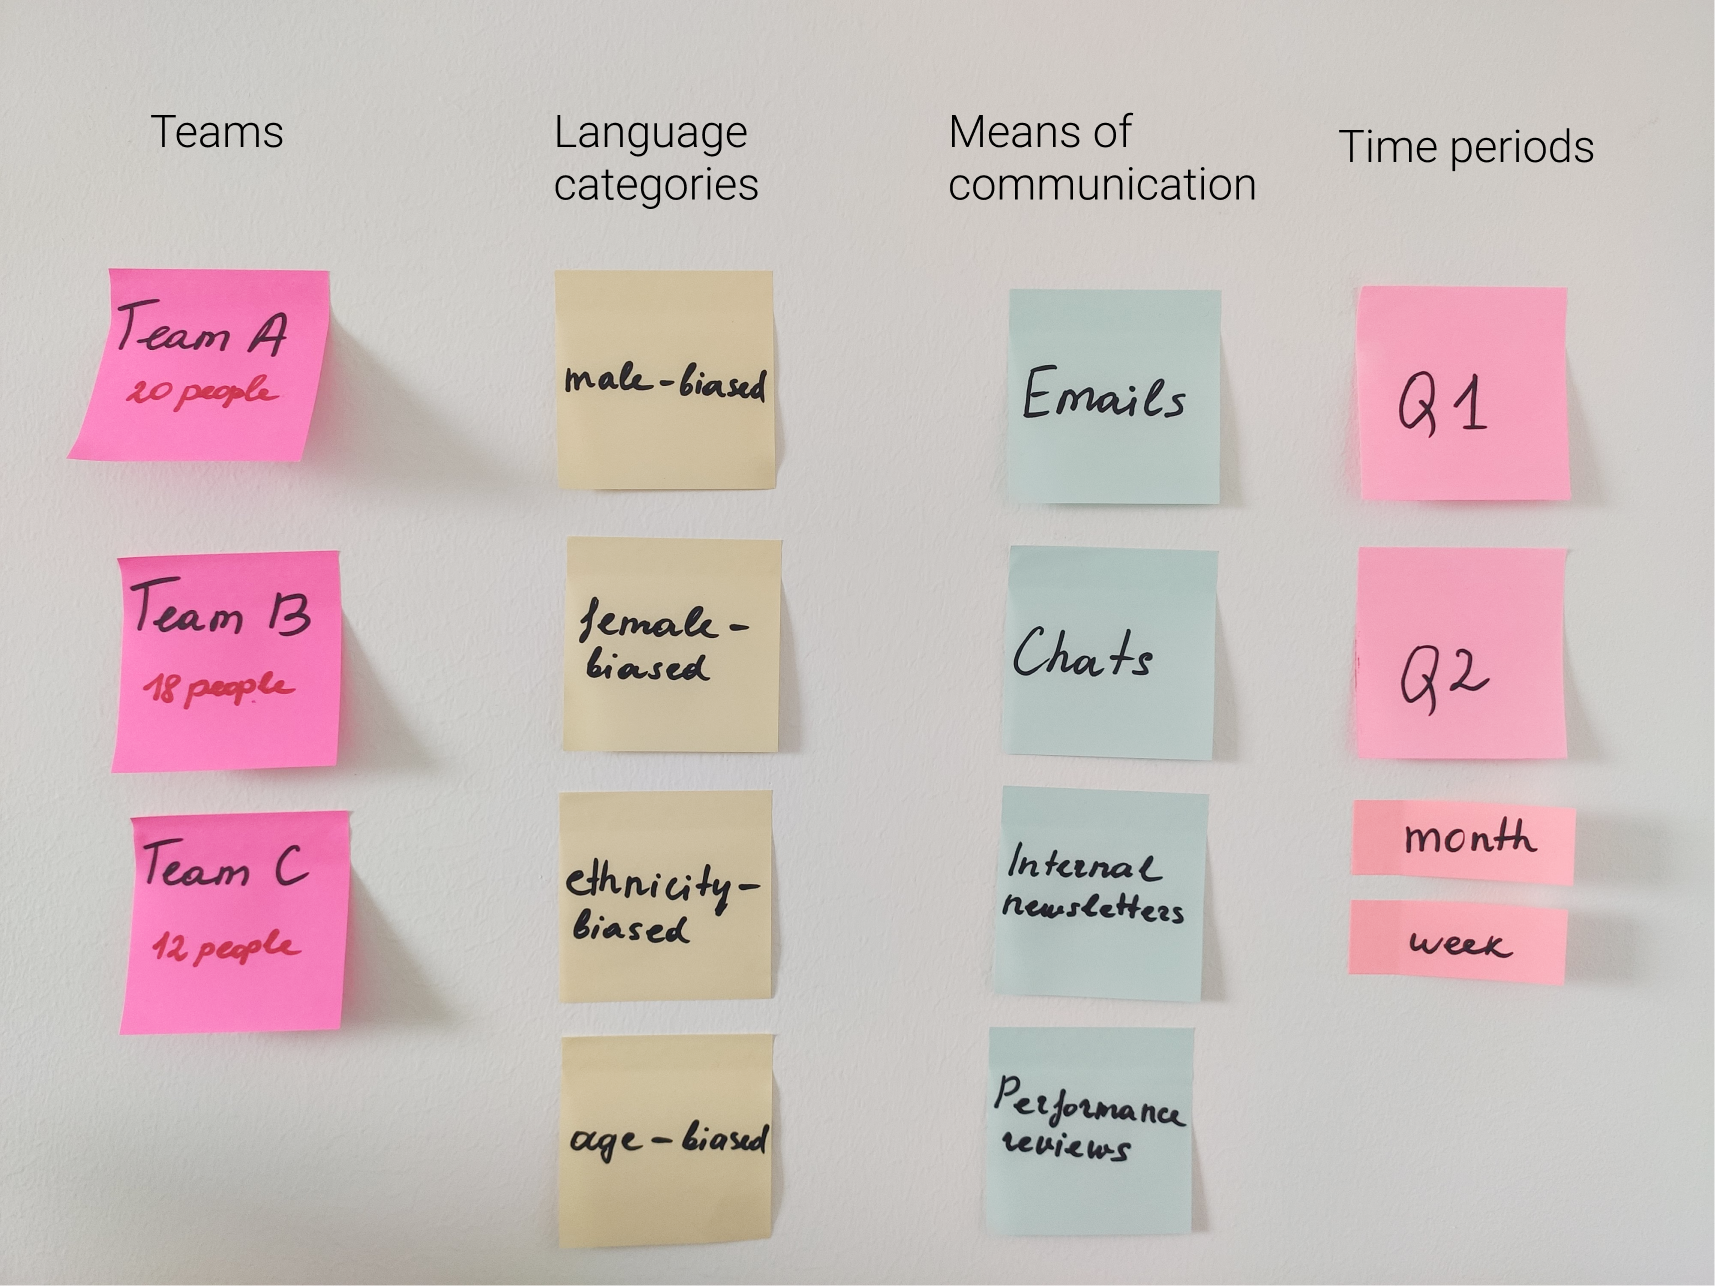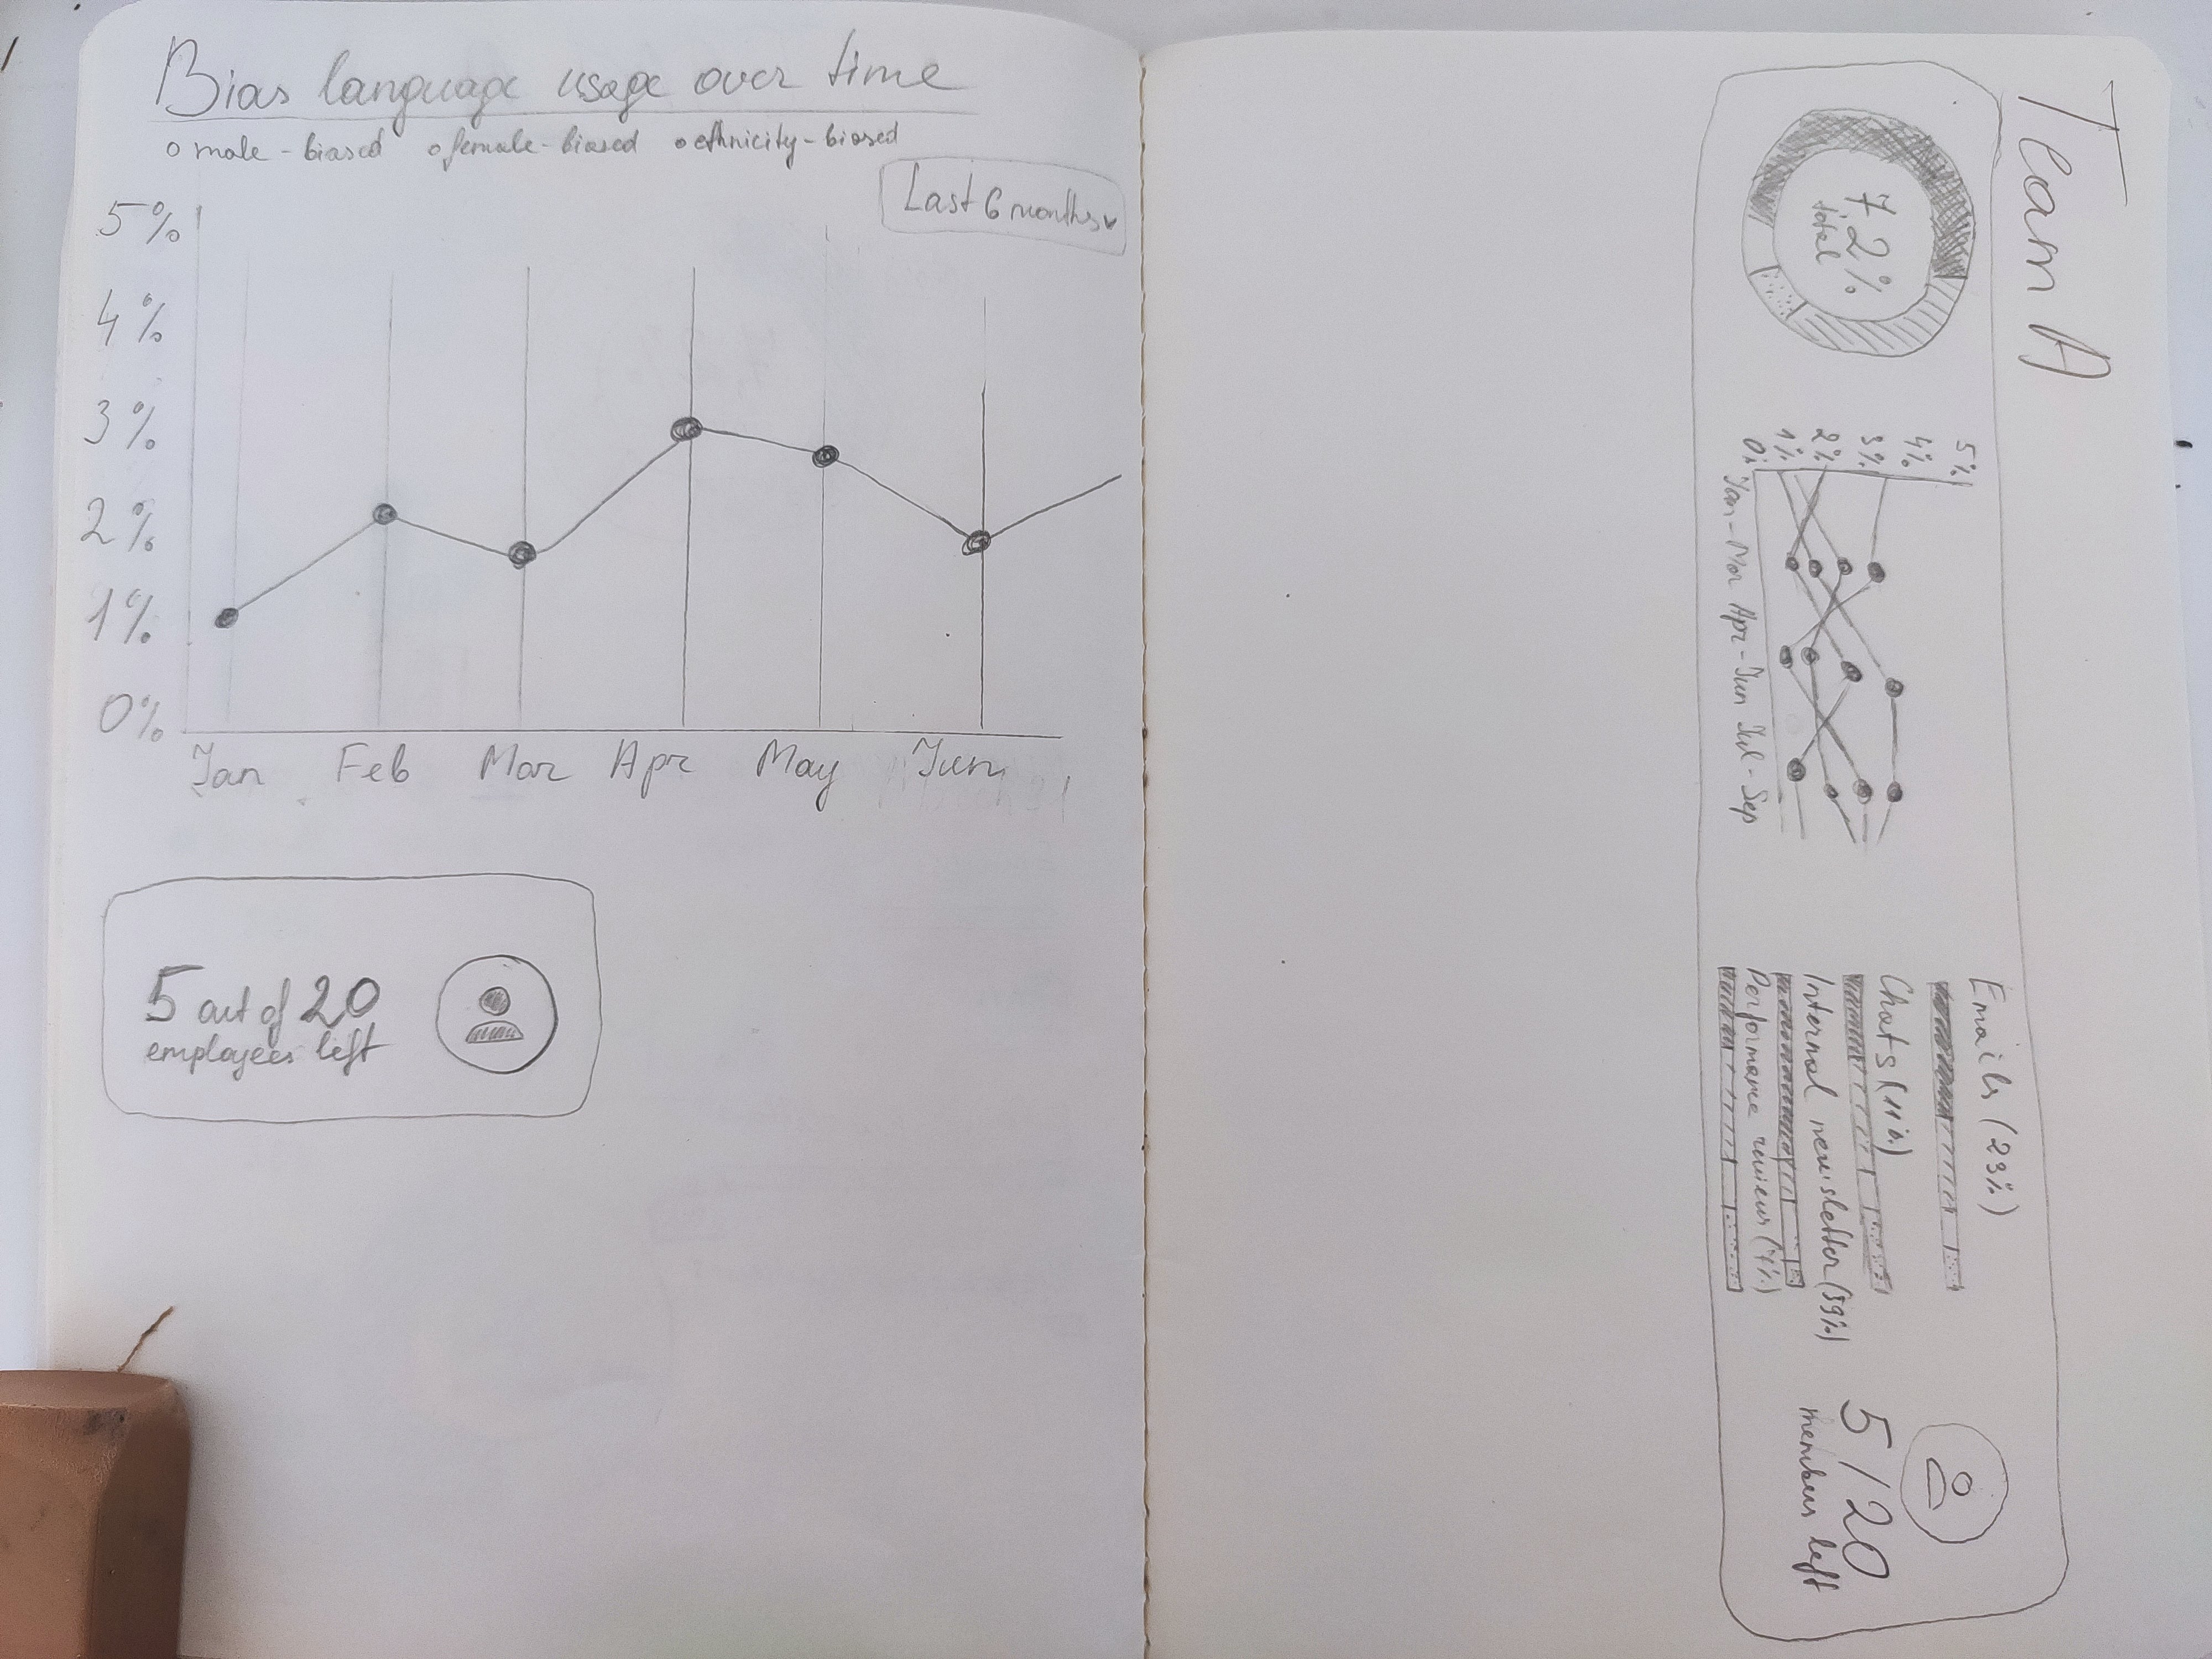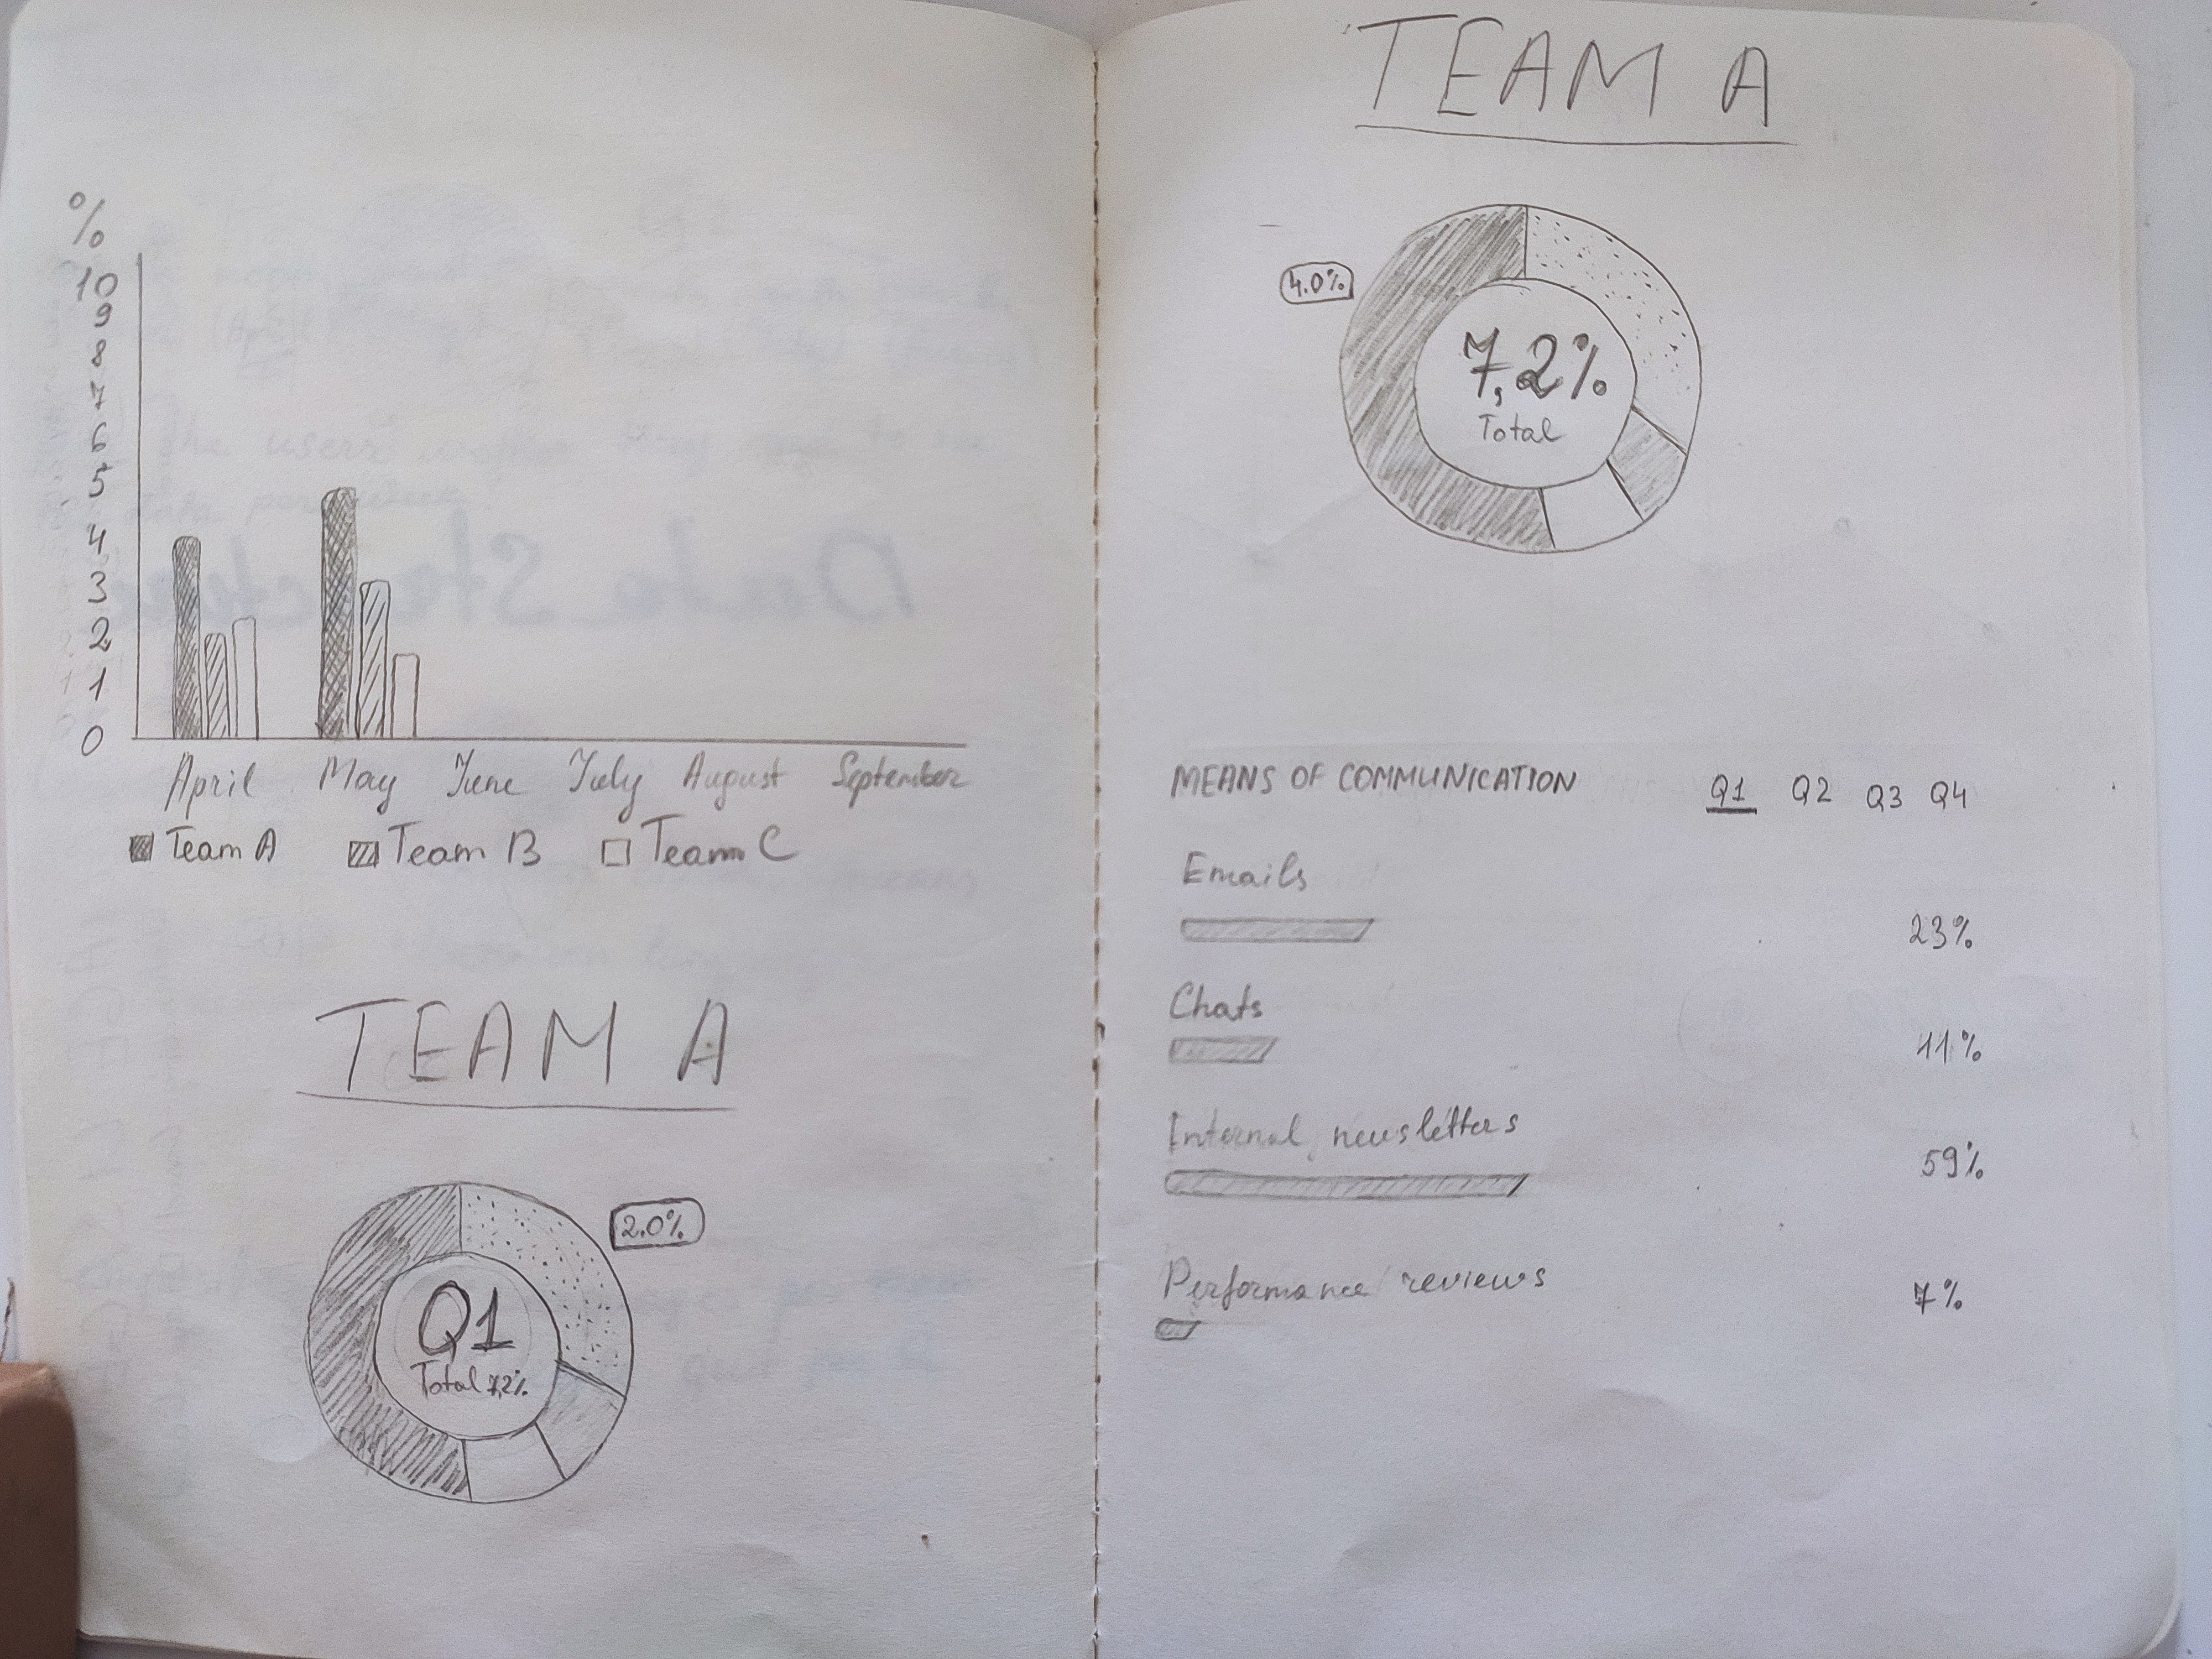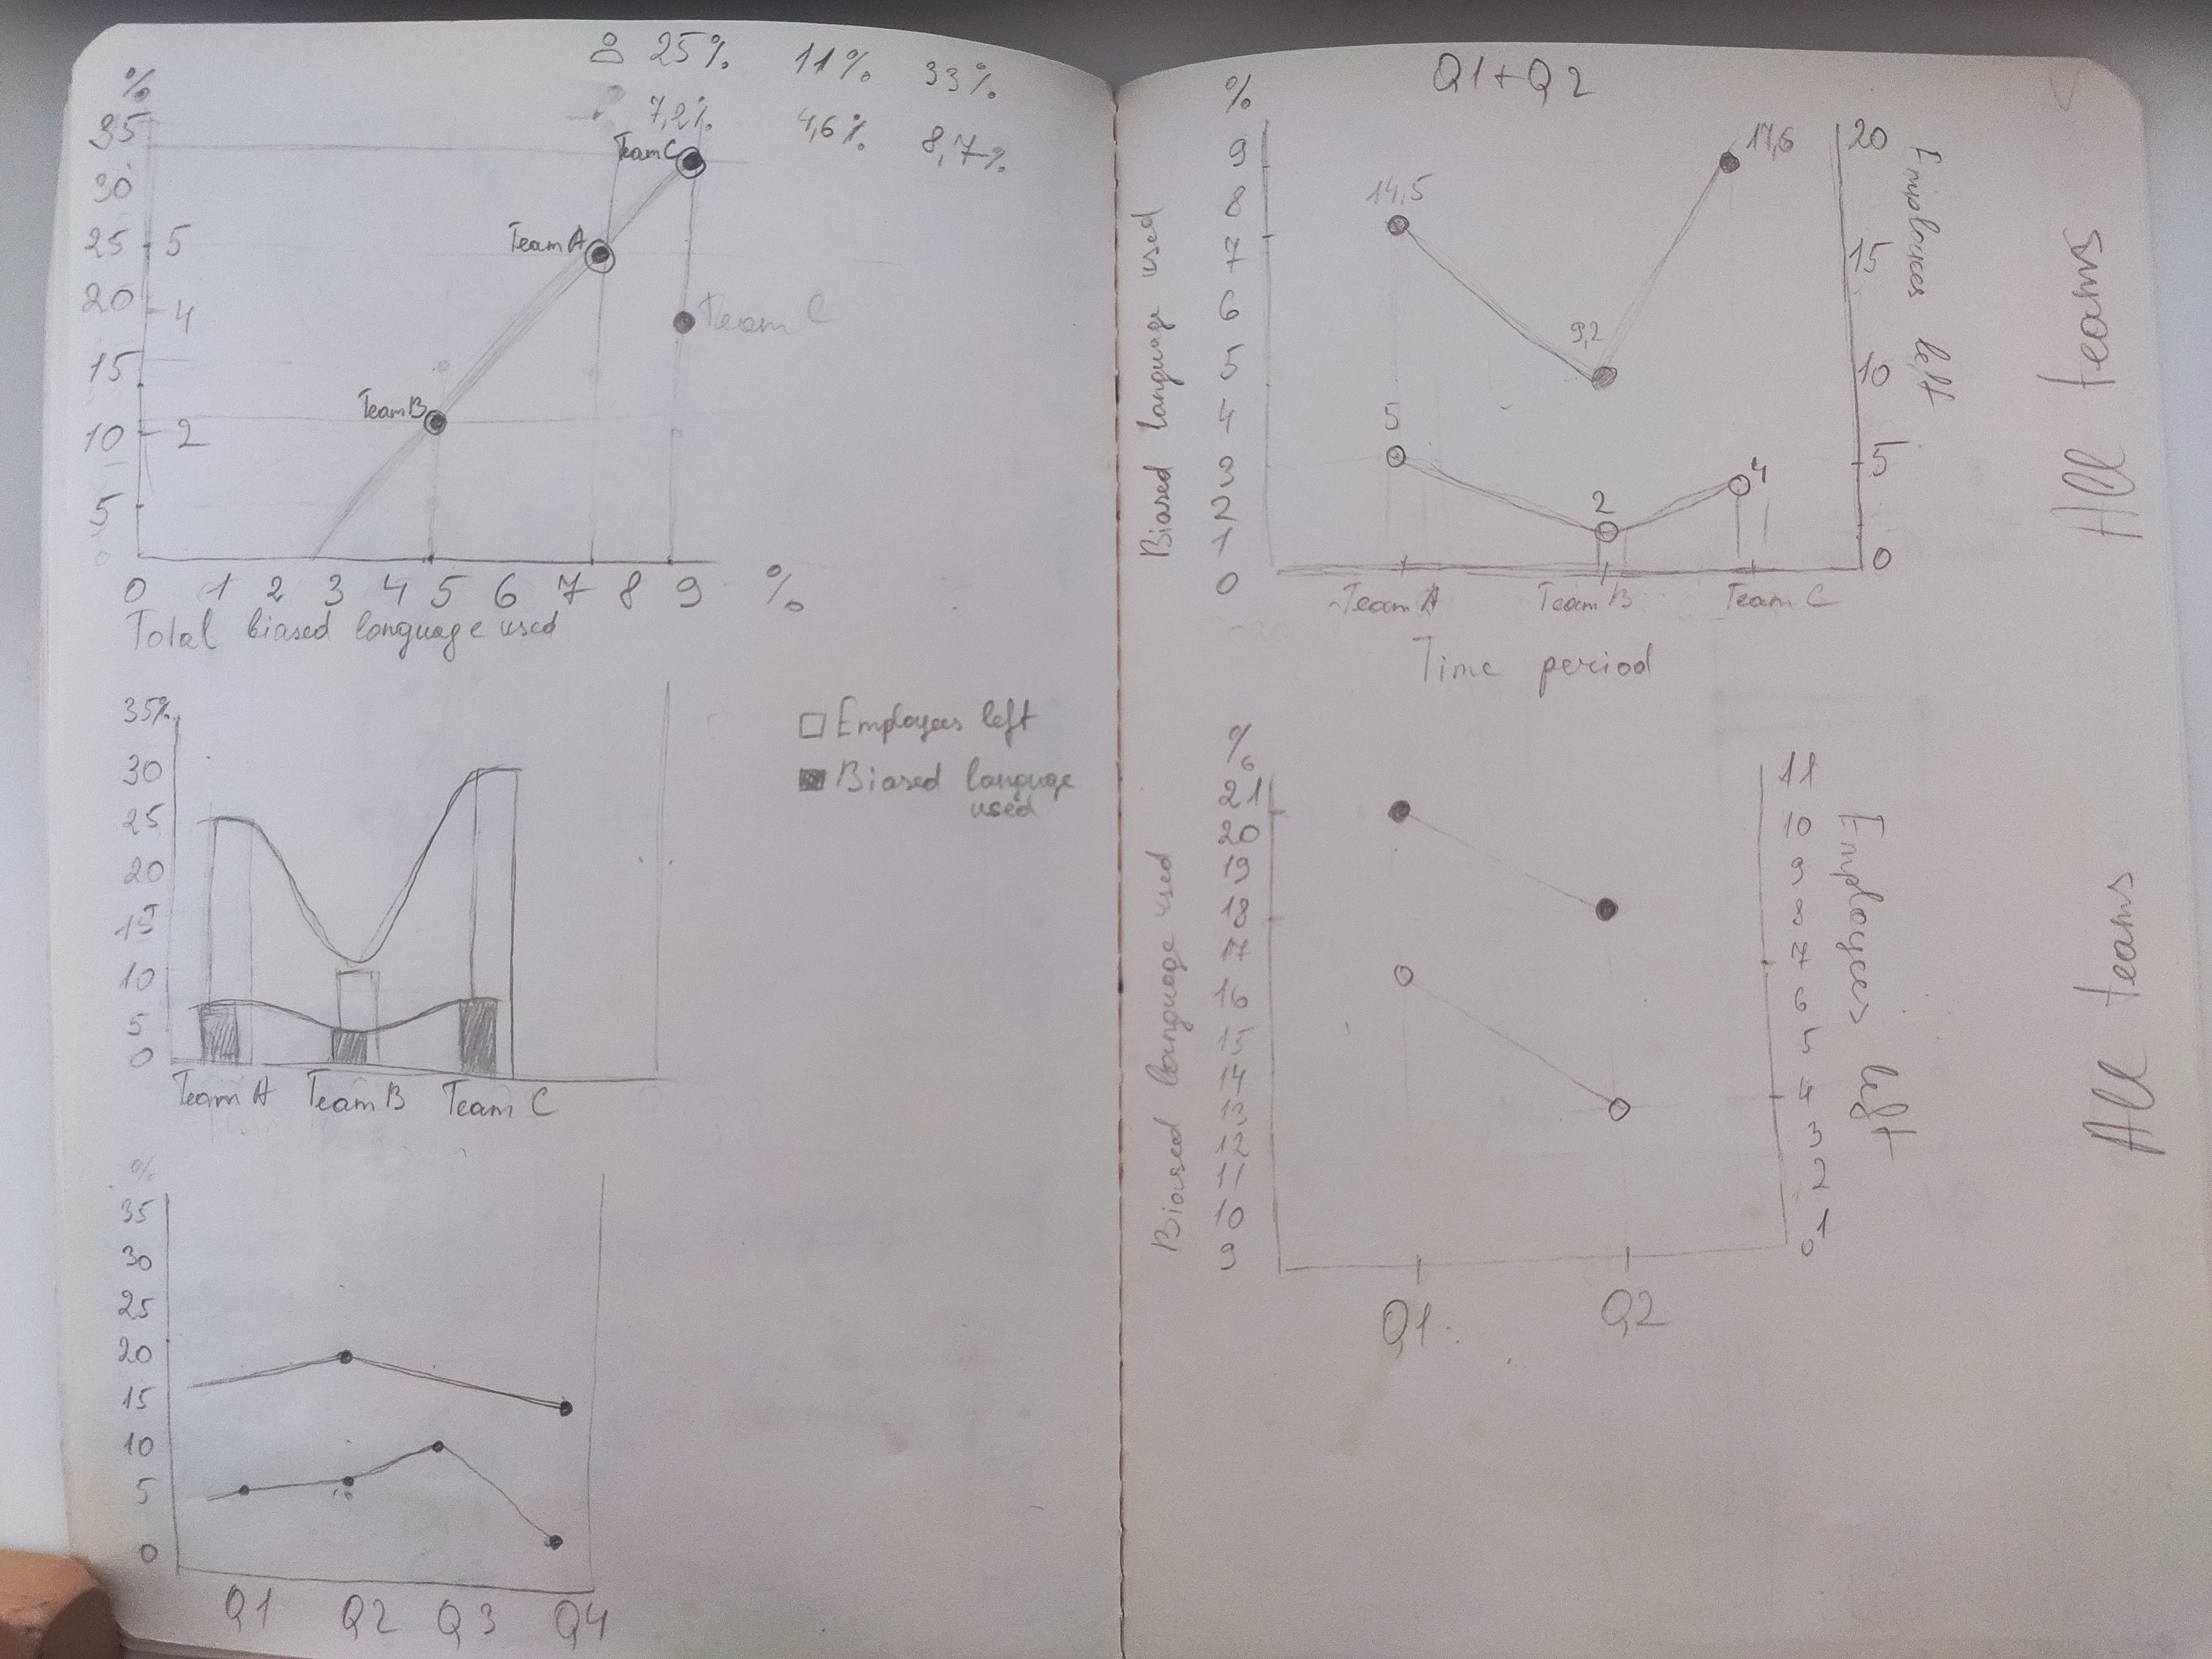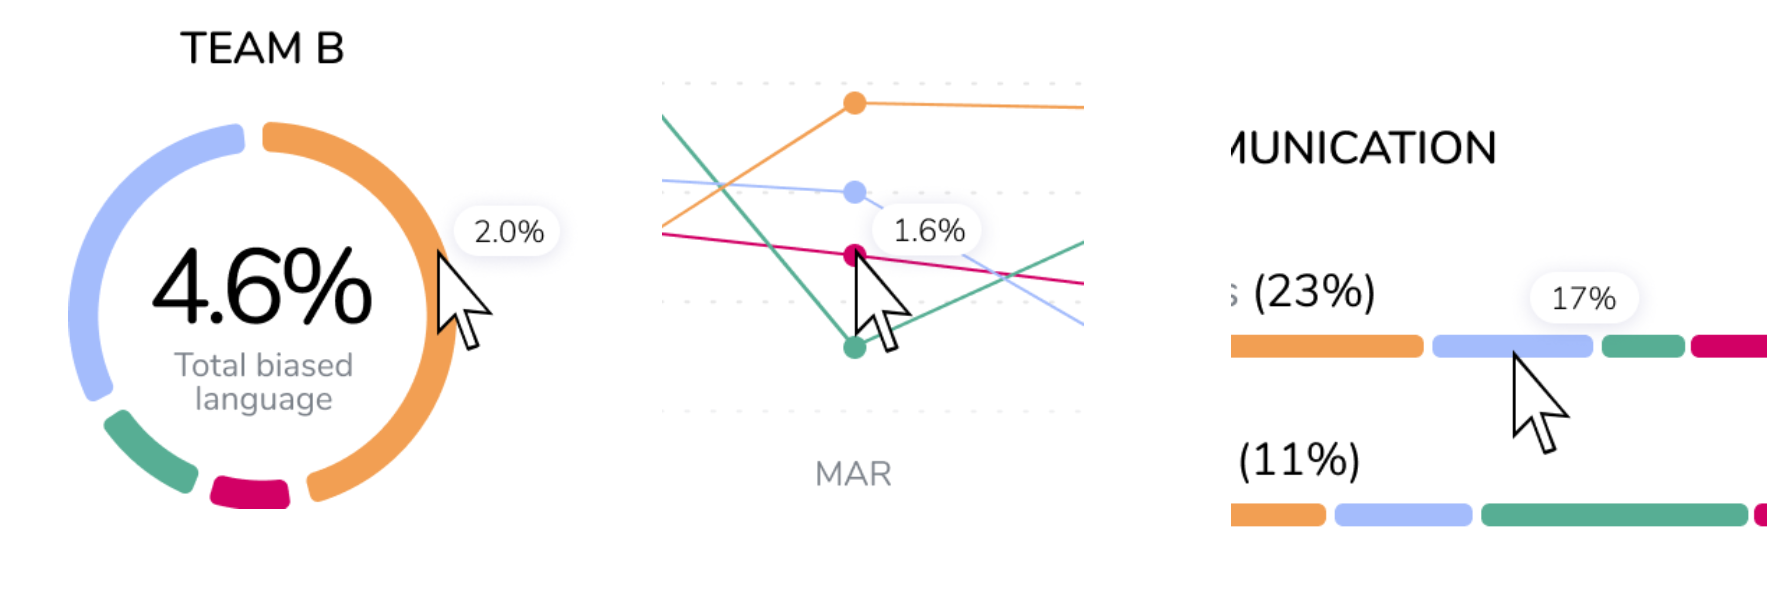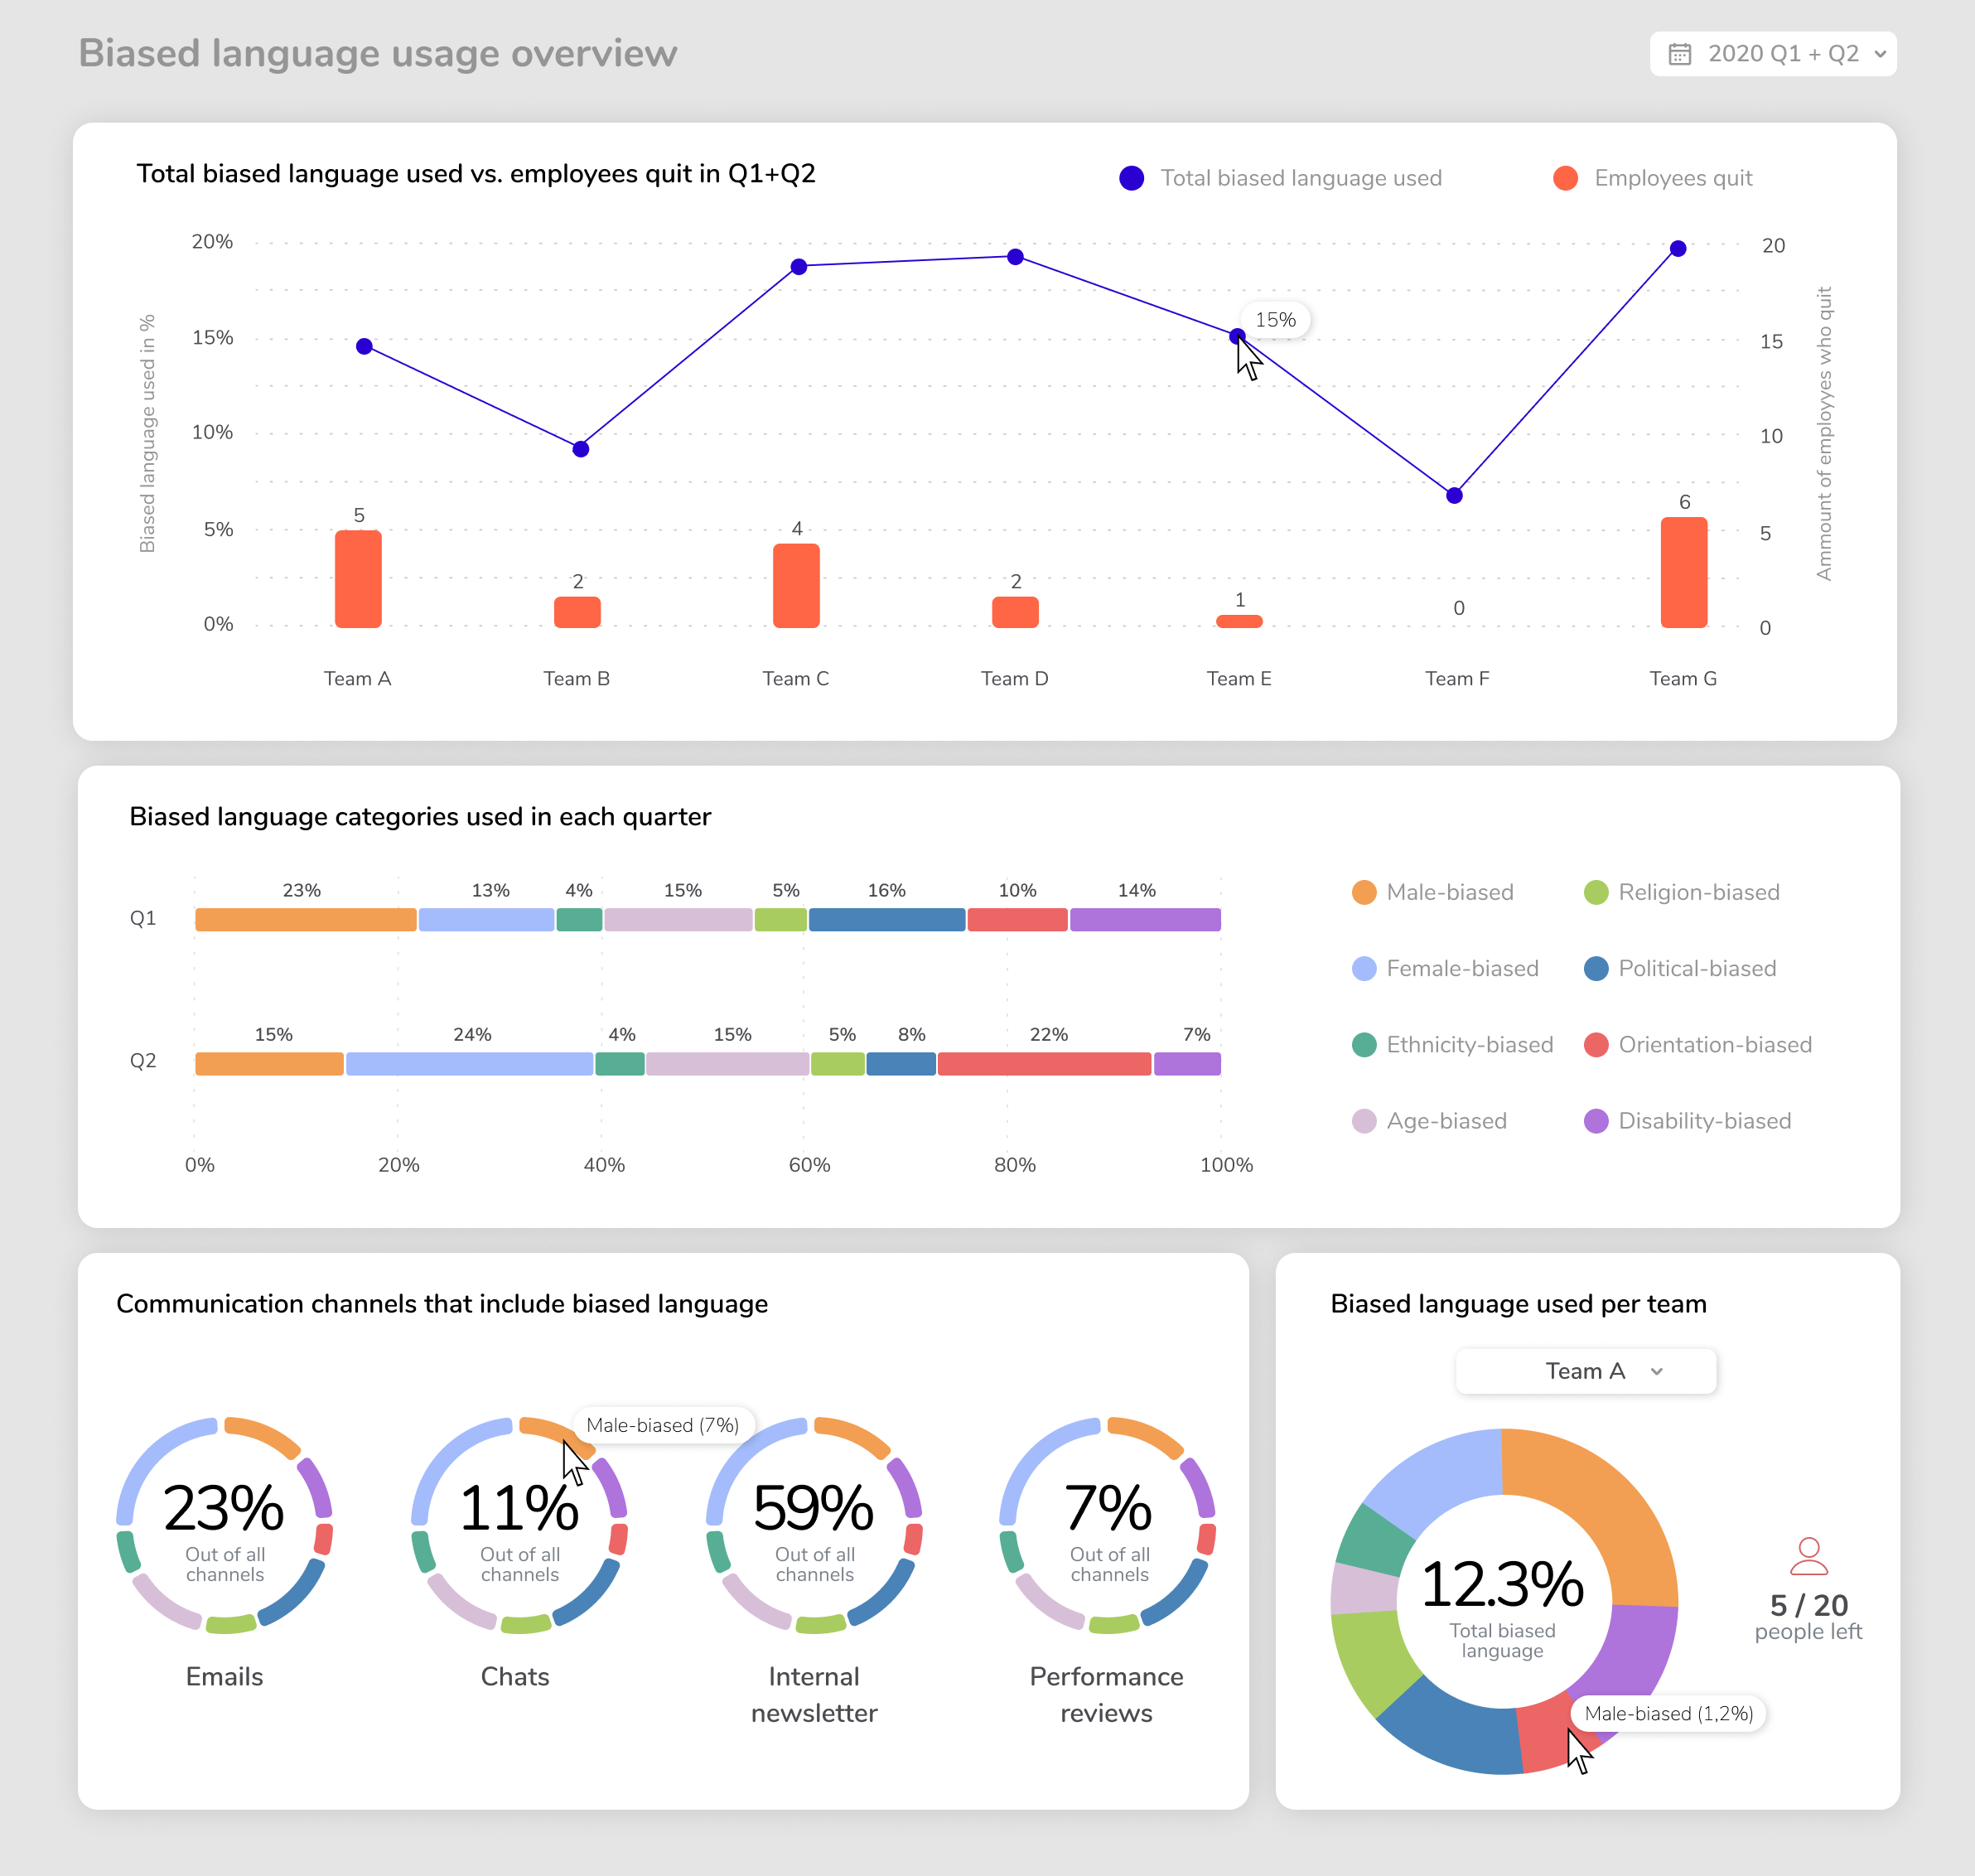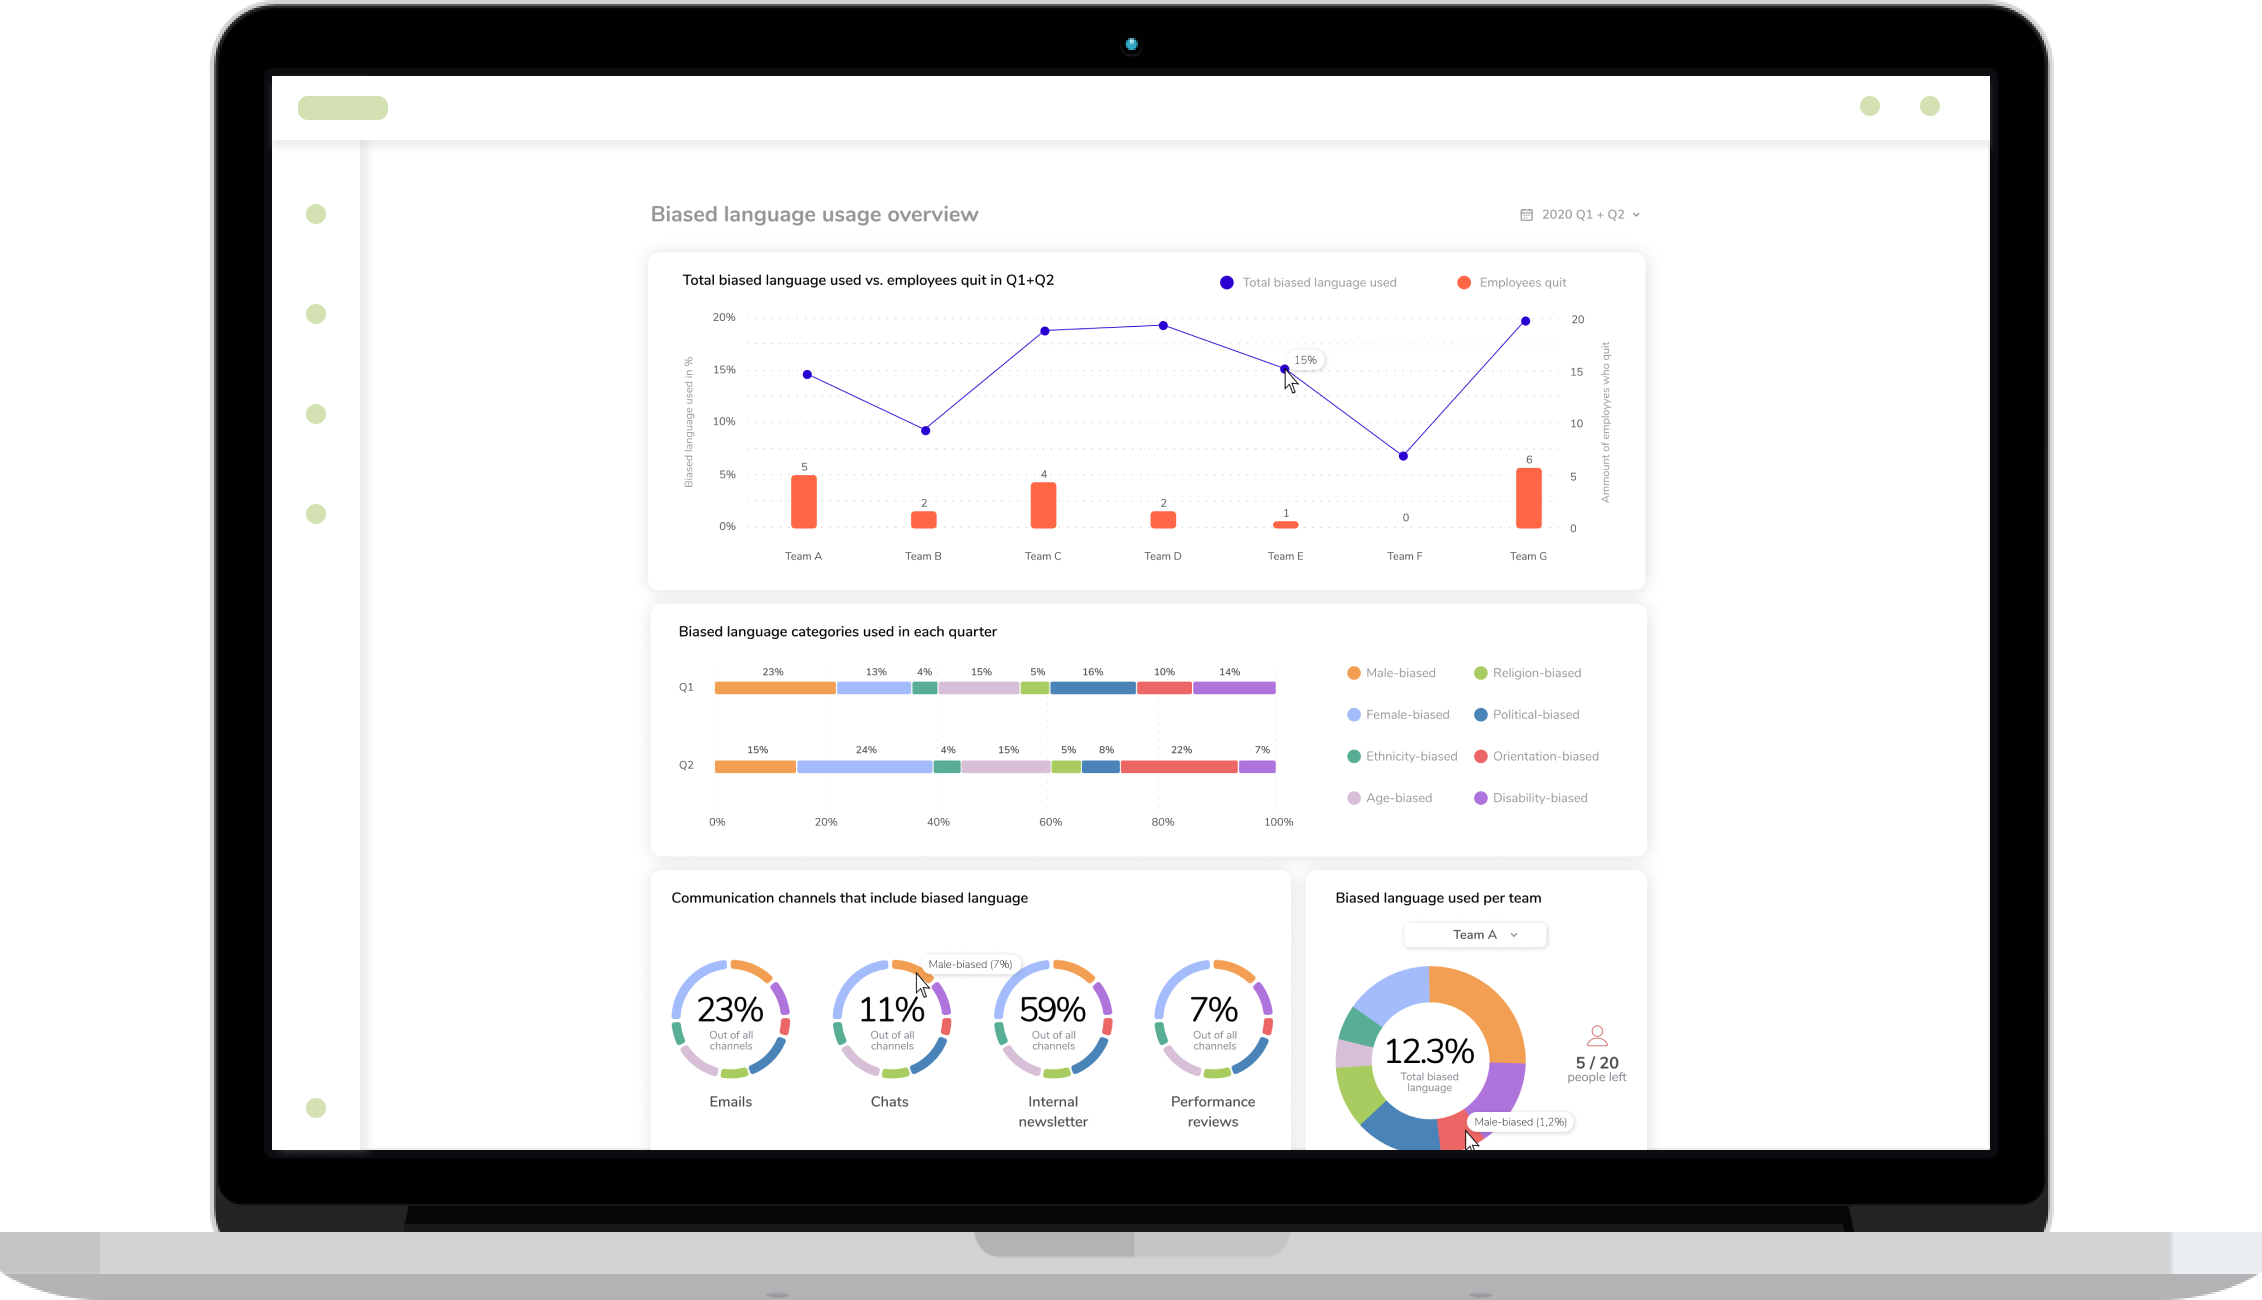
I started by summarizing the data in the spreadsheet provided by the company and writing the values on sticky notes, dividing them into categories. This let me play around with the values and manipulate them to visualize possible relationships between them, and build graphs based on those relationships.